
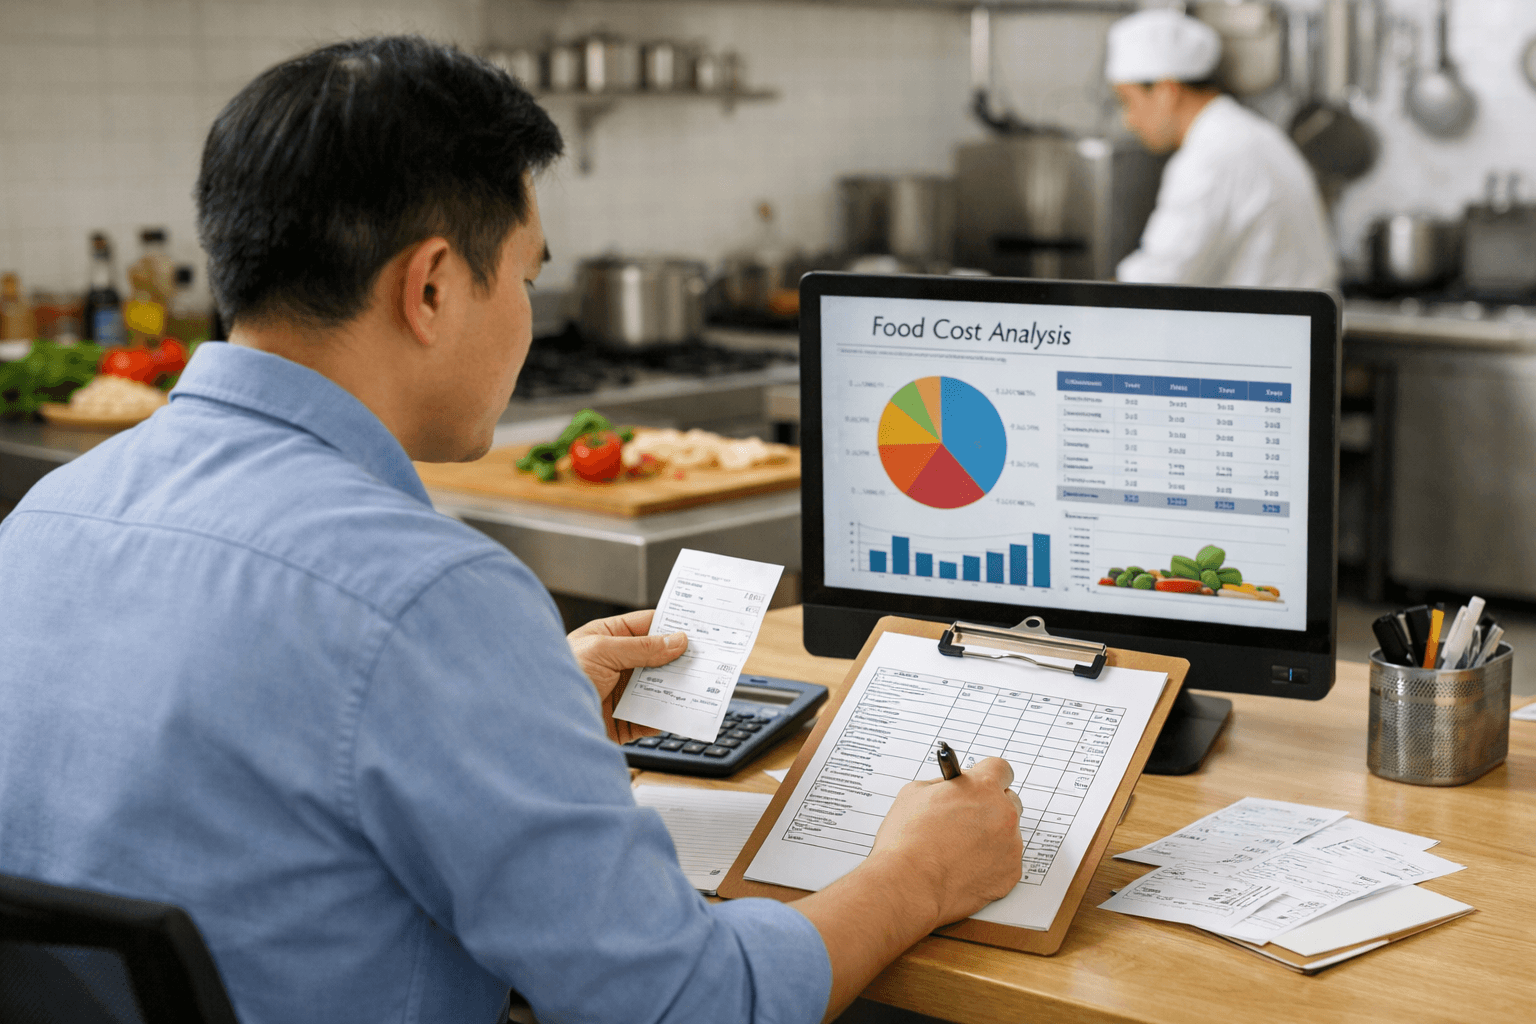
Costs are rising: where does the variance begin?
When theoretical and actual food cost diverge, telling the kitchen or bar to “save more” does not identify the cause. Portions, usable yield after preparation, waste, stock counts and outdated purchase prices all need checking.
A percentage is a signal to investigate, not proof that the entire variance is physical loss. The following editorial workflow is a practical recommendation for F&B operators, tracing the total back to ingredients, tasks and shifts that need checking.
Understand theoretical and actual food cost
In the Government of British Columbia toolkit, theoretical cost is based on each item's standard cost and the number sold. Actual cost uses the value consumed through inventory movements, after legitimate adjustments. Both calculations must cover the same period and sales scope.
| Measure | Percentage calculation |
|---|---|
| Theoretical | Sum of (items sold × standard cost per portion) ÷ corresponding sales × 100 |
| Actual | (Opening stock + purchases − closing stock, after legitimate adjustments) ÷ corresponding sales × 100 |
| Variance | Actual percentage − theoretical percentage, in percentage points |
Document how returns, stock transfers and internal meals are treated. Do not divide food costs by revenue that includes unrelated categories. This is an ingredient-cost ratio, not the outlet’s total costs or profit.
A 7-step workflow for investigating F&B losses
Step 1: Align inventory, purchases and sales periods
Set opening and closing times before collecting data. A Sunday-night stock count cannot be compared directly with sales through Monday. Keep purchase invoices, returns and transfer records with the same dataset.
Step 2: Verify stock counts and units
Count the same locations, use consistent units and distinguish raw ingredients from prepared stock. Sauce bought by the bottle but used in millilitres needs a clear conversion. Avoid counting raw ingredients again within the full value of prepared stock made from them.

Step 3: Check recipes and usable yield
the Connecticut State Department of Education explains that standardised recipes support predictable yields and consistent portions. That principle is useful for outlet recipes, although the original guidance serves school nutrition programmes. This article does not apply school meal requirements to commercial outlets.
Record ingredient quantities, method, finished yield and portioning tools. Test with the usual batch size and equipment. If a recipe expects 20 portions but normally yields only 17, verify the assumptions before costing it. This is an illustrative scenario, not survey data.
Step 4: Use actual sales mix and period-appropriate prices
Multiply each item’s sales quantity by its standard ingredient cost per portion, then add the results. A single target percentage cannot replace the actual sales mix. If purchase prices rise while the sheet retains lower old prices, theoretical cost is understated; falling prices can reverse the direction.
Step 5: Calculate actual cost and retain amounts and percentages
Start with opening stock plus purchases minus closing stock, then apply documented adjustments. Divide the scoped cost by corresponding sales and multiply by 100. Amounts show financial impact; percentages help compare periods with different sales levels.
Step 6: Separate price changes from usage changes
We recommend two lines of enquiry: prices, purchase specifications and discounts on the purchasing side; yield, portions, overproduction, remakes and waste on the usage side. A reporting variance alone is not enough to blame an individual or a shift.

Step 7: Assign specific actions and verify the result
Replace “watch the portions” with a measurable task: weigh portions of the affected item, compare them with the current recipe and record results on an agreed date. This is an organisational suggestion, not a promise that one action will eliminate all variance.
A practical review action sheet
| Variance | Check | Evidence after action |
|---|---|---|
| Costs rise across several items | Shared ingredient prices and specifications | Invoices and updated costing sheets |
| One item varies; prices are stable | Portions, yield and remakes | Test-batch and actual portion measurements |
| Unusual stocktake variance | Units, secondary stores and transfers | A recount record at a consistent cutoff |
Add an owner, review deadline and result to each row. Keep the action open until confirming evidence exists, rather than closing it after a reminder during service.
Do not confuse ingredient-cost percentage with profit
UF/IFAS Extension distinguishes production costs from other expenses and calls for a defined product and analysis period. An item should therefore not be removed solely for a high ingredient-cost percentage. Consider its contribution amount, sales volume and related costs before deciding.
The purpose of comparing theoretical and actual food cost is not an attractive percentage, but an explanation of where costs changed. Keep the workflow with the F&B operations guides; if bar procedures change, update the beverage preparation guidance so every shift uses the same version.
References
- Government of British Columbia: foodservice waste prevention toolkit, actual and theoretical cost sections
- Connecticut State Department of Education: standardised recipes
- UF/IFAS Extension: product costing primer for food entrepreneurs
Connect with Baby Boss
Explore products and Baby Boss services, or call 1900998880.
Shopee · TikTok · Instagram · Threads · YouTube · LinkedIn · Zalo OA · Pinterest
Comments